本文主要介绍Prometheus
监控平台的部署搭建与使用,并在本地搭建Prometheus
平台与各种exporter
。
1. 监控的概念 为确保信息安全,及时发现任何潜在的问题并发出告警。比如某些应用停止响应,服务器发生故障或磁盘空间不足,则会提前通知,及时解决问题避免导致更严重的问题,我们在平时工作中需要监控平台帮助我们做到实时的问题发现、问题通知等操作,防患于未然。
而监控系统在监控时尽量对有意义的指标进行监控,而非无的放矢,一般业界可参考标准为:谷歌黄金标准(延迟、流量、错误、饱和度)、RED(每秒接受请求数、失败请求数、每个请求所花费的时长 适用于云原生及微服务)。
1.1 监控的模式 Pull模型
:监控服务主动拉取被监控服务的指标被采集端无需感知监控系统的存在,完全独立于监控系统之外,这样数据的采集完全由监控系统控制,prometheus
采用pull
的模式获取监控数据。
Push模型
:被监控服务主动将指标推送到监控服务。
这两种模型在业界都有使用,在使用时需要根据自己的业务场景进行选择没有必须纠结。
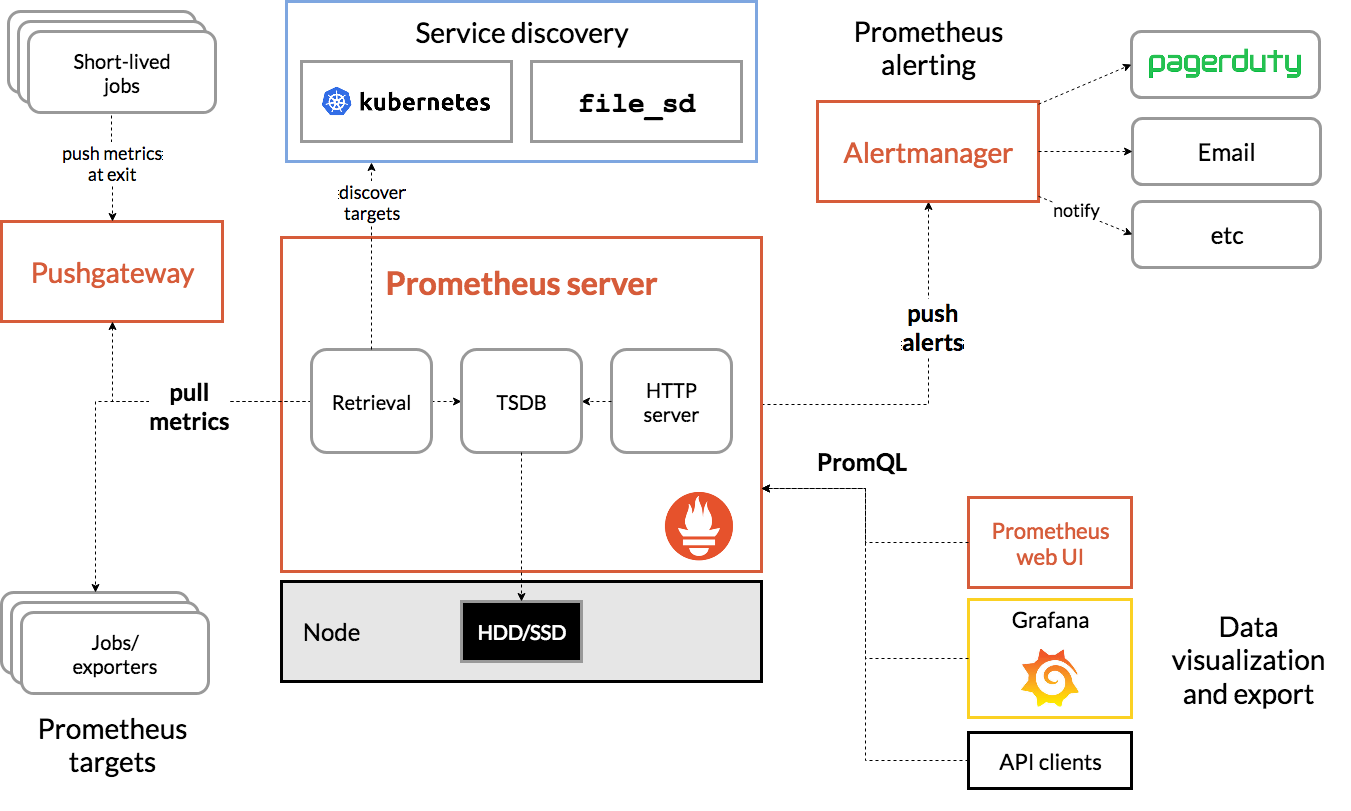
2. Prometheus介绍与安装 Prometheus
作为业界主流的监控软件,其架构以Prometheus
服务本身为中心,往下有各种各种exporter
负责信息的采集,往上可以往alertManager
推送告警信息,通过grafana
进行进一步的图形展示,自身也将数据存储在本地与远端即可。
2.1 架构
Prometheus Server:prometheus
组件中的核心部分,负责实现对监控数据的获取,存储以及查询
Exporters直接采集:直接内置了对Prometheus
监控的支持,比如cAdvisor
,Kubernetes
,Etcd
,Gokit`等
间接采集:原有监控目标并不直接支持Prometheus
,因此我们需要通过Prometheus
提供的Client Library
编写该监控目标的监控采集程序。例如: Mysql Exporter
,JMX Exporter
,Consul Exporter
等;
Alertanager AlertManager即Prometheus
体系中的告警处理中心
PushGateway 当prometheus
无法和exporter
通信时,可以利用PushGateway
来进行中转。PushGateway
将内部网络的监控数 据主动Push
到Gateway
当中。而Prometheus Server
则可以采用同样Pull
的方式从PushGateway
中获取到监控 数据
对于间接监控而言,在平时运维中针对某些地址端口联通性检测是经常使用到的,对于这种可通过安装一个blackbox_exporter
,利用ping、http、tcp等方式去探测目标的情况来进行监控,但就无法获取到更详细的监控信息了,比如:cpu、内存等信息,如果资源是放在防火墙或者NAT之后的,可以用pushprox
。
2.2 存储 Prometheus
是由SoundCloud
开发的开源监控报警系统和时序数据库(Time Series Database,TSDB),Storage
通过一定的规则清理和整理数据,并把得到的结果从年初到新的时间序列 中,这里存储的方式有两种:
本地存储。通过Prometheus
自带的时序数据库将数据库数据保存在本地磁盘。但 是本地存储的容量有限,默认保持15天
另一种是远程存储,适用于存储大量监控数据。通过中间层的适配器的转发,目前Prometheus
支持OpenTsdb
、InfluxDB
、Elasticsearch
等后端存储,通过适配器实现Prometheus
存储的remote write
和remote read
接口,便可以接入Prometheus
作为 远程存储使用。
2.3 安装 1 2 3 4 5 6 7 8 9 10 11 12 13 14 15 16 17 18 19 20 21 22 23 24 25 26 27 28 29 30 31 32 33 34 35 36 37 38 39 40 # 1. 下载地址 https://prometheus.io/download/ # 2. tar xvf prometheus-2.40.5.linux-arm64.tar.gz -C # 3. [root@a93fbab9aa5e prometheus]# pwd /opt/prometheus [root@a93fbab9aa5e prometheus]# ll total 209328 -rw-r--r-- 1 1001 122 11357 Dec 1 13:46 LICENSE -rw-r--r-- 1 1001 122 3773 Dec 1 13:46 NOTICE drwxr-xr-x 2 1001 122 4096 Dec 1 13:46 console_libraries drwxr-xr-x 2 1001 122 4096 Dec 1 13:46 consoles -rwxr-xr-x 1 1001 122 111257069 Dec 1 12:58 prometheus # 运行文件 -rw-r--r-- 1 1001 122 934 Dec 1 13:46 prometheus.yml # 配置文件 -rwxr-xr-x 1 1001 122 103062680 Dec 1 13:00 promtool # 检查配置是否正确的运行文件# 4. 配置启动文件 通过systemd的方式启动 [root@a93fbab9aa5e prometheus]# cat /usr/lib/systemd/system/prometheus.service [Unit] Description=Daemon After=syslog.target systemd-sysctl.service network.target [Service] Type=simple User=root # 注意启动用户 Group=root ExecStart=/opt/prometheus/prometheus \ --config.file=/opt/prometheus/prometheus.yml \ --storage.tsdb.path=/opt/prometheus/data \ --storage.tsdb.retention=15d \ --web.console.templates=/opt/prometheus/consoles \ --web.console.libraries=/opt/prometheus/console_libraries \ --web.max-connections=512 \ --web.external-url=http://172.17.0.2:9090 \ --web.listen-address=0.0.0.0:9090 Restart=on-failure [Install] WantedBy=multi-user.target# 5. 服务启动 [root@a93fbab9aa5e prometheus]# systemctl daemon-reload [root@a93fbab9aa5e prometheus]# systemctl start prometheus.service # 服务端口 9090# 通过浏览器http://172.17.0.2:9090即可访问
配置文件介绍:
1 2 3 4 5 6 7 8 9 10 11 12 13 14 15 16 17 18 19 20 21 22 23 24 25 26 27 28 29 [root@xwhs prometheus ]global: scrape_interval: 15s evaluation_interval: 15s alerting: alertmanagers: - static_configs: - targets: rule_files: scrape_configs: - job_name: "prometheus" static_configs: - targets: ["localhost:9090" ]
一般在修改配置文件后,建议先检查配置,在重启服务:
1 2 3 [root@ylinyang prometheus]# ./promtool check config prometheus.yml Checking prometheus.yml SUCCESS: prometheus.yml is valid prometheus config file syntax
3. exporter 各种exporter
的安装包都可以在官网 进行查找。
3.1 node_exporter 1 2 3 4 5 6 7 8 9 10 11 12 13 14 15 16 17 18 19 20 21 22 23 24 25 26 27 # 1. 下载解压 [root@xwhs opt]# wget https://github.com/prometheus/node_exporter/releases/download/v1.5.0/node_exporter-1.5.0.linux-amd64.tar.gz# 2. 没啥特殊就一个二进制文件 [root@xwhs node_exporter]# pwd /opt/node_exporter [root@xwhs node_exporter]# ll total 19336 -rw-r--r-- 1 3434 3434 11357 Nov 30 03:05 LICENSE -rwxr-xr-x 1 3434 3434 19779640 Nov 30 02:59 node_exporter -rw-r--r-- 1 3434 3434 463 Nov 30 03:05 NOTICE# 3. 配置启动文件 [root@xwhs node_exporter]# cat /usr/lib/systemd/system/node_exporter.service [Unit] Description=Daemon After=syslog.target systemd-sysctl.service network.target [Service] Type=simple User=root Group=root ExecStart=/opt/node_exporter/node_exporter Restart=on-failure [Install] WantedBy=multi-user.target [root@xwhs node_exporter]# systemctl daemon-reload [root@xwhs node_exporter]# systemctl start node_exporter # 服务启动端口之后是9100
修改prometheus
的启动配置文件,添加如上的exporter
信息,修改如下:
1 2 3 4 5 6 7 8 9 10 11 # 添加如下三行 注意格式与对齐 [root@xwhs prometheus]# tail -n 3 prometheus.yml - job_name: "node_exporter" static_configs: - targets: ["127.0.0.1:9100"] # 检查配置 [root@xwhs prometheus]# ./promtool check config prometheus.yml Checking prometheus.yml SUCCESS: prometheus.yml is valid prometheus config file syntax # 重启prometheus [root@xwhs prometheus]# systemctl restart prometheus # 再次登录即可看到两组指标信息
3.2 mysqld_exporter 检测mysql的相关信息时,需要单独为mysqld_exporter创建一个账号,通过这个账号mysqld_exporter才能获取到相应的指标参数。
1 2 3 4 5 6 7 8 9 10 11 12 13 [root@xwhs ~]# yum install mariadb-server -y [root@xwhs ~]# systemctl start mariadb [root@xwhs ~]# mysql Welcome to the MariaDB monitor. Commands end with ; or \g. Your MariaDB connection id is 3 Server version: 5.5.68-MariaDB MariaDB Server Copyright (c) 2000, 2018, Oracle, MariaDB Corporation Ab and others. Type 'help;' or '\h' for help. Type '\c' to clear the current input statement. MariaDB [(none)]> grant process,replication client,select on *.* to 'mysqld_exporter'@'localhost' identified by 'mysqld_exporter'; Query OK, 0 rows affected (0.00 sec)
1 2 3 4 5 6 7 8 9 10 11 12 13 14 15 16 17 18 19 20 21 22 23 24 25 26 27 28 29 30 31 32 33 34 35 36 37 38 # 在官网下载myqld_exporter,解压并配置配置密码文件,启动脚本 [root@xwhs mysqld_exporter]# cat mysqld_exporter.cnf # 密码文件 [client] user=mysqld_exporter password=mysqld_exporter [root@xwhs mysqld_exporter]# cat /usr/lib/systemd/system/mysqld_exporter.service # 启动文件 [Unit] Description=Prometheus MySQL Exporter After=network.target User=root Group=root [Service] Type=simple Restart=always ExecStart=/opt/mysqld_exporter/mysqld_exporter \ --config.my-cnf /opt/mysqld_exporter/mysqld_exporter.cnf \ --collect.global_status \ --collect.info_schema.innodb_metrics \ --collect.auto_increment.columns \ --collect.info_schema.processlist \ --collect.binlog_size \ --collect.info_schema.tablestats \ --collect.global_variables \ --collect.info_schema.query_response_time \ --collect.info_schema.userstats \ --collect.info_schema.tables \ --collect.perf_schema.tablelocks \ --collect.perf_schema.file_events \ --collect.perf_schema.eventswaits \ --collect.perf_schema.indexiowaits \ --collect.perf_schema.tableiowaits \ --collect.slave_status \ --web.listen-address=0.0.0.0:9104 [Install] WantedBy=multi-user.target [root@xwhs mysqld_exporter]# systemctl daemon-reload; systemctl start mysqld_exporter
1 2 3 4 5 # 修改prometheus配置文件,添加mysqld_exporter的target,重启prometheus在查看 [root@xwhs prometheus]# tail -n 3 prometheus.yml - job_name: "mysqld_exporter" static_configs: - targets: ["127.0.0.1:9104"]
当我们需要查询某一项指标信息的时候,首先需要知道直接的查询语句,比如要查询mysql
的慢查询信息,直接在mysql
中查询为:show global status like 'slow%que%'
;而我们需要将其转化为promQL
语句为mysql_global_status_slow_queries
在prometheus
中进行查询。
3.3 blackbox_exporter 通过安装blackbox_exporter
检测不能安装exporter
的机器中服务的存活性,如下探测114.114.114.114
地址的是否存活。
1 2 3 4 5 6 7 8 9 10 11 12 13 14 15 16 17 18 19 20 21 22 23 24 25 26 27 28 # 官网下载解压、安装、配置blackbox.yml文件 该文件记录了需要探测的信息 配置启动文件 # 配置blackbox.yml文件,添加如下几行配置参数 [root@xwhs blackbox_exporter]# head blackbox.yml modules: http_2xx: prober: http http: method: GET valid_status_codes: [] preferred_ip_protocol: "ipv4" ip_protocol_fallback: false http_post_2xx: prober: http [root@xwhs blackbox_exporter]## 配置启动文件 [root@xwhs blackbox_exporter]# cat /usr/lib/systemd/system/blackbox_exporter.service [Unit] Description=blackbox_exporter After=network.target [Service] Type=simple User=root Group=root ExecStart=/opt/blackbox_exporter/blackbox_exporter --config.file=/opt/blackbox_exporter/blackbox.yml Restart=on-failure [Install] WantedBy=multi-user.target
1 2 3 4 5 6 7 8 9 10 11 12 13 14 15 16 - job_name: 'ping_all' scrape_interval: 1m metrics_path: /probe params: module: [icmp ] static_configs: - targets: - 114.114 .114 .114 labels: instance: gg relabel_configs: - source_labels: [__address__ ] target_label: __param_target - target_label: __address__ replacement: 127.0 .0 .1 :9115
1 2 3 4 5 6 7 8 9 10 11 12 13 14 15 16 - job_name: 'baidu_http' scrape_interval: 1m metrics_path: /probe params: module: [http_2xx ] static_configs: - targets: - www.baidu.com labels: instance: baidu relabel_configs: - source_labels: [__address__ ] target_label: __param_target - target_label: __address__ replacement: 127.0 .0 .1 :9115
其他第三方exporter
可在官网 进行查询
3.4 telegraf 在检查某些资源时也可以不安装对应的exporter
,可以安装telegraf
在这个包中,集成了很多服务的监控文件,一个即可检测多个服务情况。
1 2 3 4 5 6 7 8 9 10 # 1. 下载地址 https://github.com/influxdata/telegraf/tags # 2. 监控各种资源的配置文档 https://github.com/influxdata/telegraf/tree/master/plugins/inputs # 3. 下载安装 wget https://dl.influxdata.com/telegraf/releases/telegraf-1.24.4-1.x86_64.rpm rpm -ivh telegraf-1.24.3-1.x86_64.rpm systemctl start telegraf# 4. 配置文件 /etc/telegraf/telegraf.conf # 为telegraf自身的配置文件 /etc/telegraf/telegraf.d # 该目录为各种资源配置文件的目录# 5. 在prometheus中添加job时 端口为telegraf资源配置文件中定义的端口
4. 服务发现 当每次有新的资源指标需要添加时,都需要重新修改配置文件比较麻烦,可以通过服务发现的方式进行自动配置
4.1 基于文件的服务发现 1 2 3 4 5 6 7 8 9 10 11 # 重新修改prometheus配置文件,如下 scrape_configs: - job_name: "prometheus" file_sd_configs: # 修改方式为文件发现 - files: - targets/prometheus-*.yaml # 文件存储放的位置 refresh_interval: 2m # 文件加载重载时间# 编辑文件 这个文件可以手动编写 也可以自动生成 [root@xwhs prometheus]# cat targets/prometheus-node.yaml - targets: - "127.0.0.1:9100"
4.2 基于consul的服务发现 安装consul
服务,这个服务将信息注册到consul
里面,prometheus
监控从consul
里面获取各服务指标信息。
1 2 3 4 5 6 7 8 9 10 11 12 13 14 15 16 17 18 19 20 21 22 23 24 25 26 27 28 29 30 31 32 33 # 1. 安装consul 下载地址 https://releases.hashicorp.com/consul # 2. 配置启动文件 注意文件和数据目录 journalctl -xe |grep consul 排查命令 [root@xwhs opt]# cat /usr/lib/systemd/system/consul.service [Unit] Description=Daemon consul After=syslog.target systemd-sysctl.service network.target [Service] Type=simple User=root Group=root ExecStart=/opt/consul agent -server -bootstrap \ -bind=192.168.0.115 \ -client=192.168.0.115 \ -data-dir=/opt/data -ui -node=192.168.0.115 Restart=on-failure [Install] WantedBy=multi-user.target# 3. http://192.168.0.115:8500 登录 # 4. 修改prometheus文件 添加consul 这里services下匹配的name,不是id [root@wxhs prometheus]# tail -n 5 prometheus.yml - job_name: "node_exporter" consul_sd_configs: - server: 192.168.0.115:8500 services: - "node-exporter1" # 只添加这个 如果啥都不行就是把consul发现的所以都获取到 # 包括consul自己 只不过他的端口是8300 但是他会报错 relabel_configs: # 标签过滤 是一门学问 - source_labels: [__meta_consul_service_id] regex: consul action: drop# 可以参考该文章 https://blog.csdn.net/aixiaoyang168/article/details/103022342#3Consul__17
1 2 3 4 5 6 # consul的基本操作 # 注册服务 curl -X PUT -d '{"id":"node-exporter1","name":"node-exporter1","address":"127.0.0.1","port":9100,"tags":["node- exporter1"],"checks":[{"http":"http://127.0.0.1:9100/","interval":"5s"}]}' http://192.168.0.115:8500/v1/agent/service/register# 删除服务 最后跟的是id 不是名字 curl --request PUT http://192.168.0.115:8500/v1/agent/service/deregister/node-exporter1
4.3 基于k8s的服务发现 1 2 3 4 5 6 7 8 9 10 11 12 13 14 15 - job_name: 'kubernetes-apiservers-monitor' kubernetes_sd_configs: - role: endpoints api_server: https://192.168.26.100:6443 tls_config: insecure_skip_verify: true bearer_token_file: /apps/prometheus/k8s.token scheme: https tls_config: insecure_skip_verify: true bearer_token_file: /apps/prometheus/k8s.token relabel_configs: - source_labels: [__meta_kubernetes_namespace , __meta_kubernetes_service_name , __meta_kubernetes_endpoint_port_name ] action: keep regex: default;kubernetes;http
4.4 基于dns的服务发现 基于dns
的服务发现,需要在环境中配置一个dns
服务器,并且将prometheus
的dns
修改,通过dns
的SRV
于A记录进行服务发现。
1 2 3 4 5 6 7 8 9 10 11 12 13 14 15 16 17 18 19 20 21 22 23 24 25 26 # 1. 配置dns服务器 yum install unbound -y systemctl enable unbound --now # 2. 修改配置文件 重启服务 修改如下行内容 46-interface: 0.0.0.0 240-access-control: 0.0.0.0/0 allow 292-username: "" # 3. 添加解析记录文件,创建/etc/unbound/local.d/aa.conf 内容如下 local-zone: "rhce.cc." static local-data: "rhce.cc. 86400 SOA vms82.rhce.cc. root 111 2000 1000 4000 86400" local-data: "_node-exporter._tcp.rhce.cc. 300 IN SRV 3 1 9100 vms81.rhce.cc." local-data: "_node-exporter._tcp.rhce.cc. 300 IN SRV 3 1 9100 vms82.rhce.cc." local-data: "rhce.cc. NS vms82.rhce.cc." local-data: "vms81.rhce.cc. A 192.168.26.81" local-data: "vms82.rhce.cc. A 192.168.26.82" # 4. 修改prometheus的配置文件 # 基于SRV记录 - job_name: "node_exporter" dns_sd_configs: - names: ["_node-exporter._tcp.rhce.cc"] #refresh_interval: 2m # 基于dns记录 - job_name: "node_exporter" dns_sd_configs: - names: ["vms81.rhce.cc"] type: A port: 9100 - names: ["vms82.rhce.cc"] type: A port: 9100
在各种服务发现中,最常用的就是文件发现和consul
发现:
文件发现:可以配置一个cmdb
平台,统一收集IP地址,通过脚本或者接口的方式,自动生成对应的yml文件
consul
:通过脚本的方式注册到consul
平台,confd
+consul_template
自动渲染prometheus
配置文件